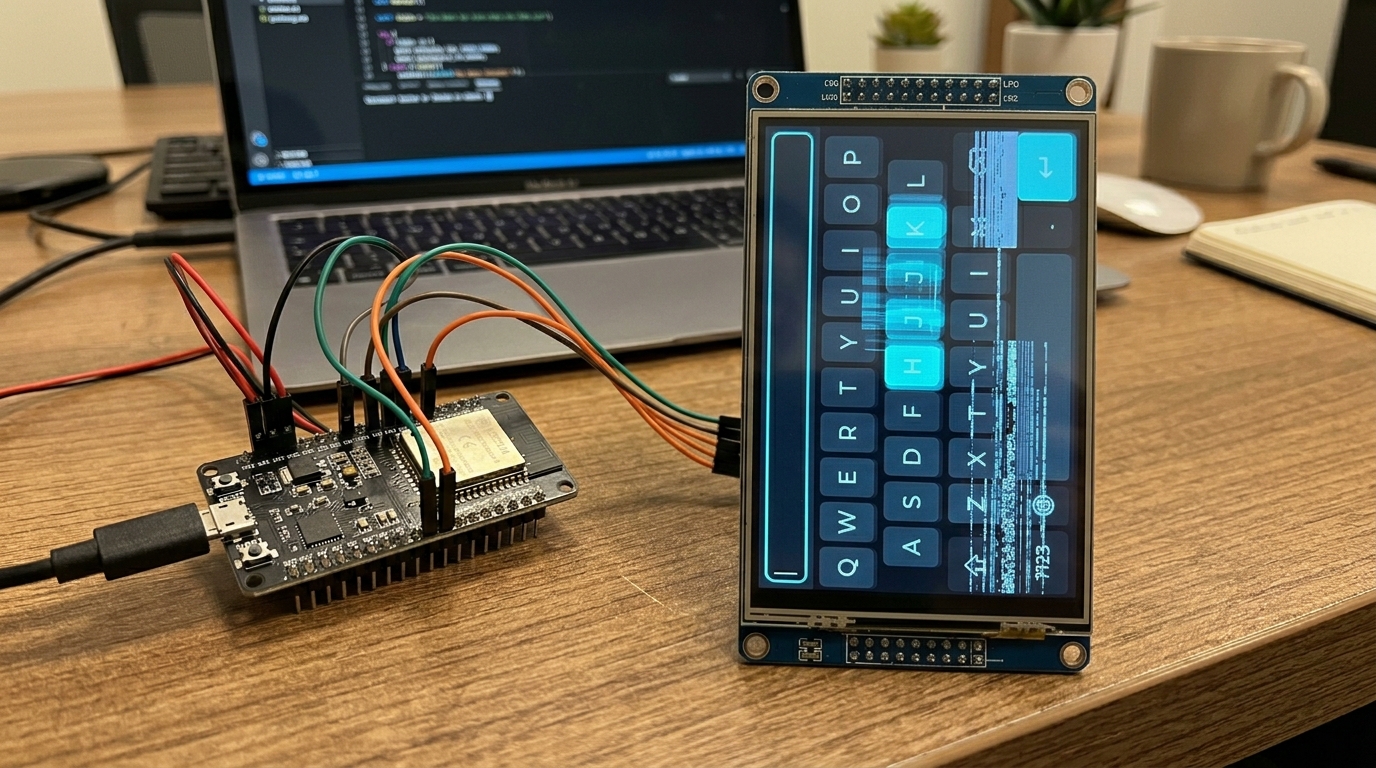
A colleague had just reached a critical milestone, getting a stable LVGL-based UI running on our product’s 5" MIPI display. It was a significant piece of driver work: MicroPython application code on an NXP i.MX RT1176 (Cortex-M7 @ 1 GHz), driving LVGL v9 on a 720x1280 MIPI DSI touchscreen. An embedded system, not a phone or PC.
The UI worked, but the on-screen keyboard was unusable. Each keypress took nearly 200ms to render, dropping to 1-2 FPS while typing, missing many keypresses entirely. For context, touchscreen input generally needs 30+ FPS (under 33ms per frame) to feel responsive, and 60+ FPS to feel smooth. We were at 5 FPS on a good frame. That performance is unusable for a client demo, let alone a shipping product, and without any obvious cause for the lag it wasn’t clear if we had a fundamental hardware/design failure or a fixable configuration issue.
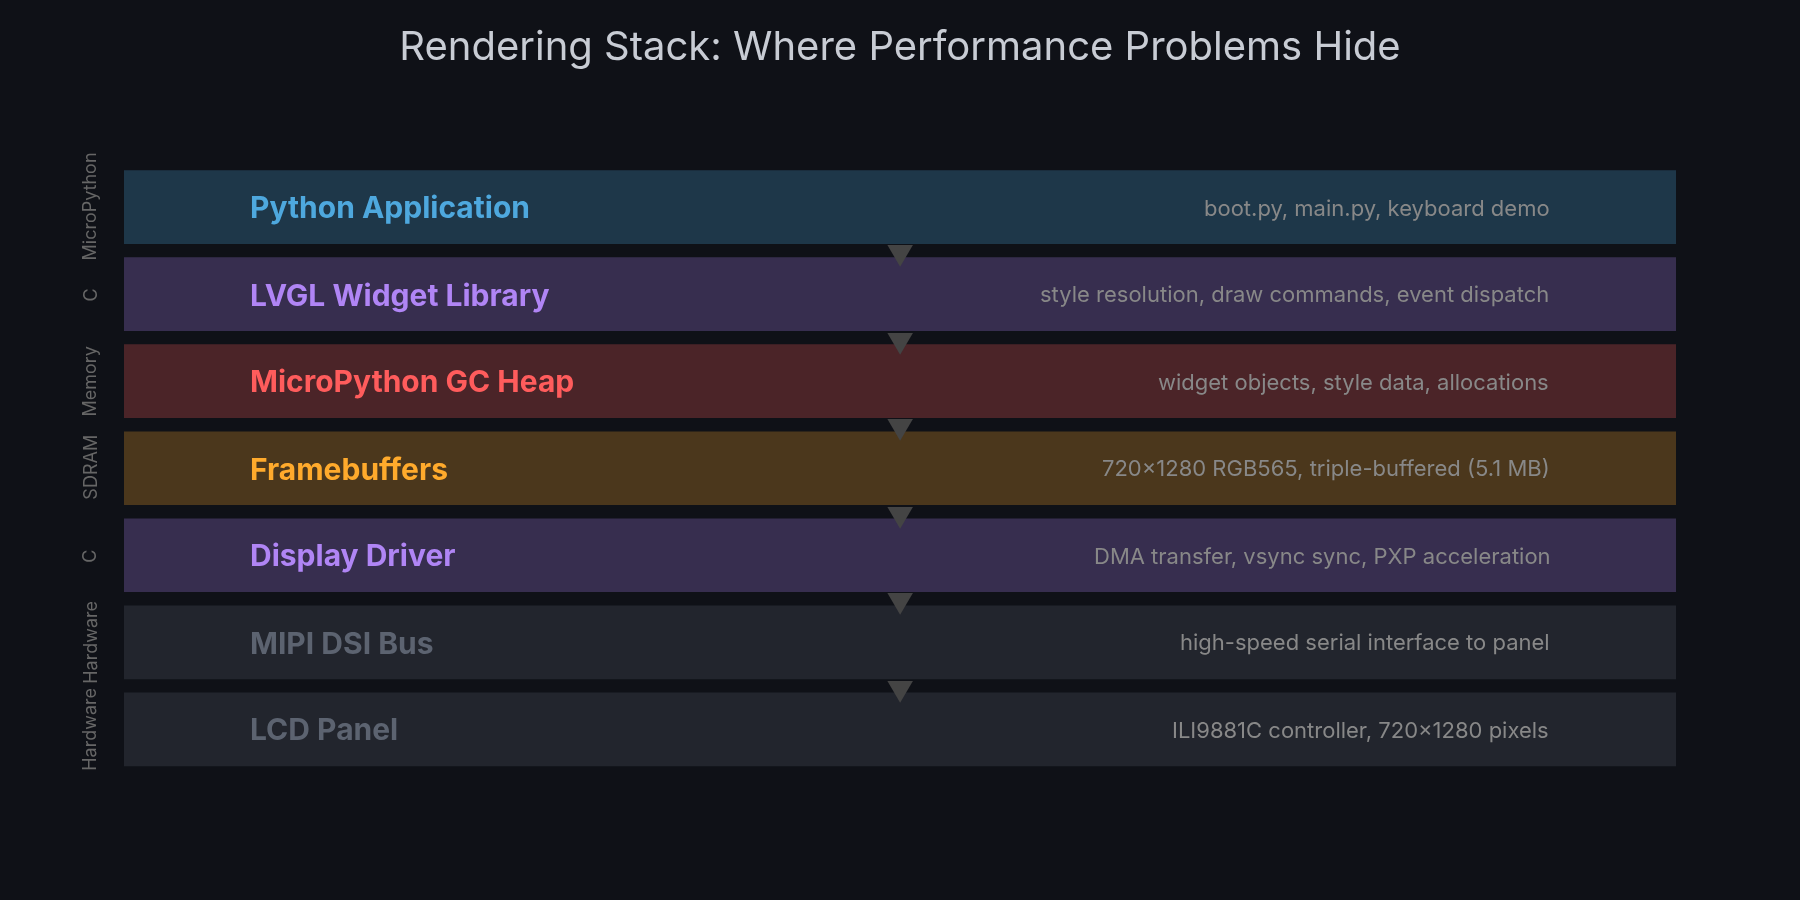
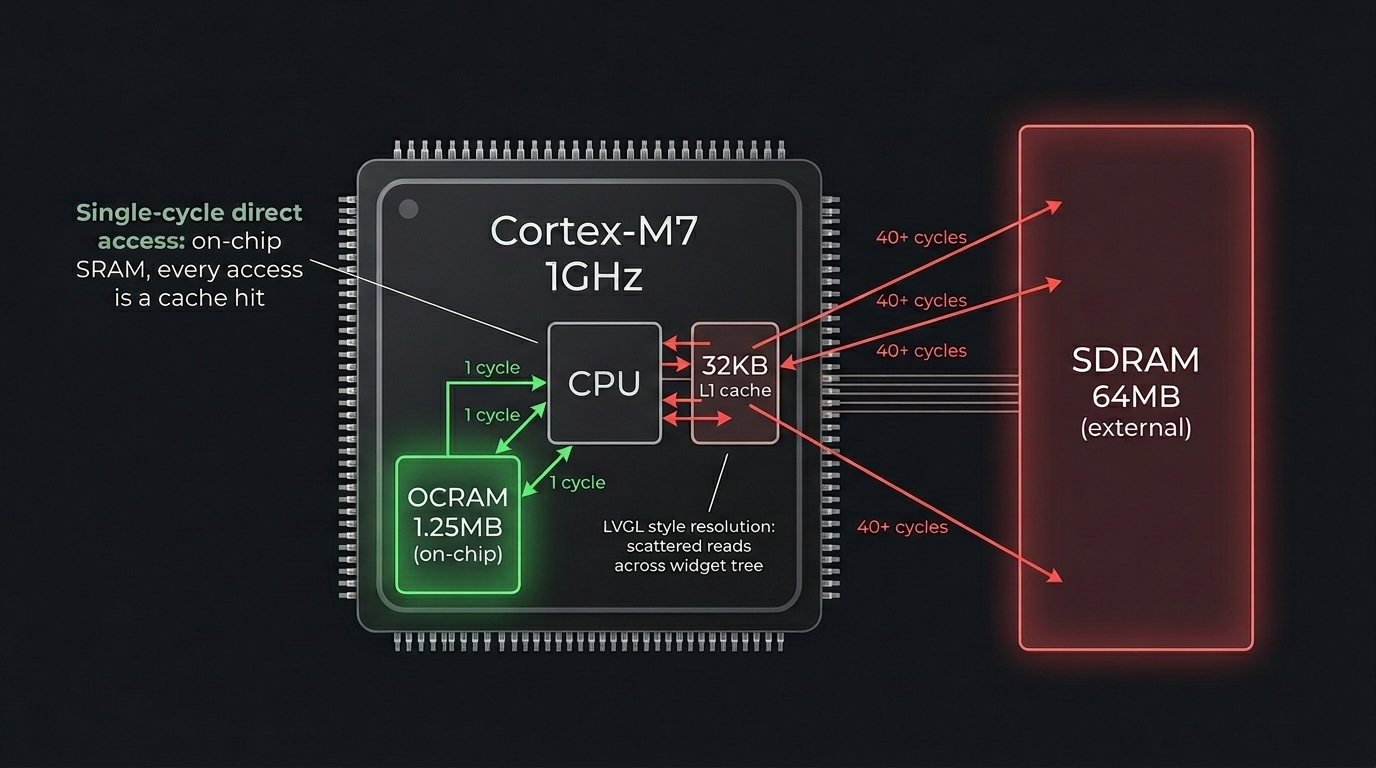
The rendering stack on this platform is deep. Application code in Python calls LVGL’s C widget library, which walks a tree of objects resolving styles and generating draw commands. Those draw commands produce pixel data into framebuffers allocated in SDRAM. A DMA engine transfers completed frames over the MIPI DSI bus to the LCD panel’s controller, synchronised with the display’s vsync signal. There are cache interactions at every level, MPU configuration affects memory access patterns, and the MicroPython garbage collector periodically freezes everything to scan the heap. A performance problem could originate at any layer.
This same LVGL keyboard widget is routinely used on much slower microcontrollers. Something was fundamentally wrong with how our system was configured, but with that many layers the root cause wasn’t obvious.
My initial plan was pretty modest: use Claude Code to investigate the driver stack, identify potential causes, and triage how much effort it would take to fix. Estimate next steps, basically. Once we got started though, it became clear we could actually fix it directly with the approach being taken.
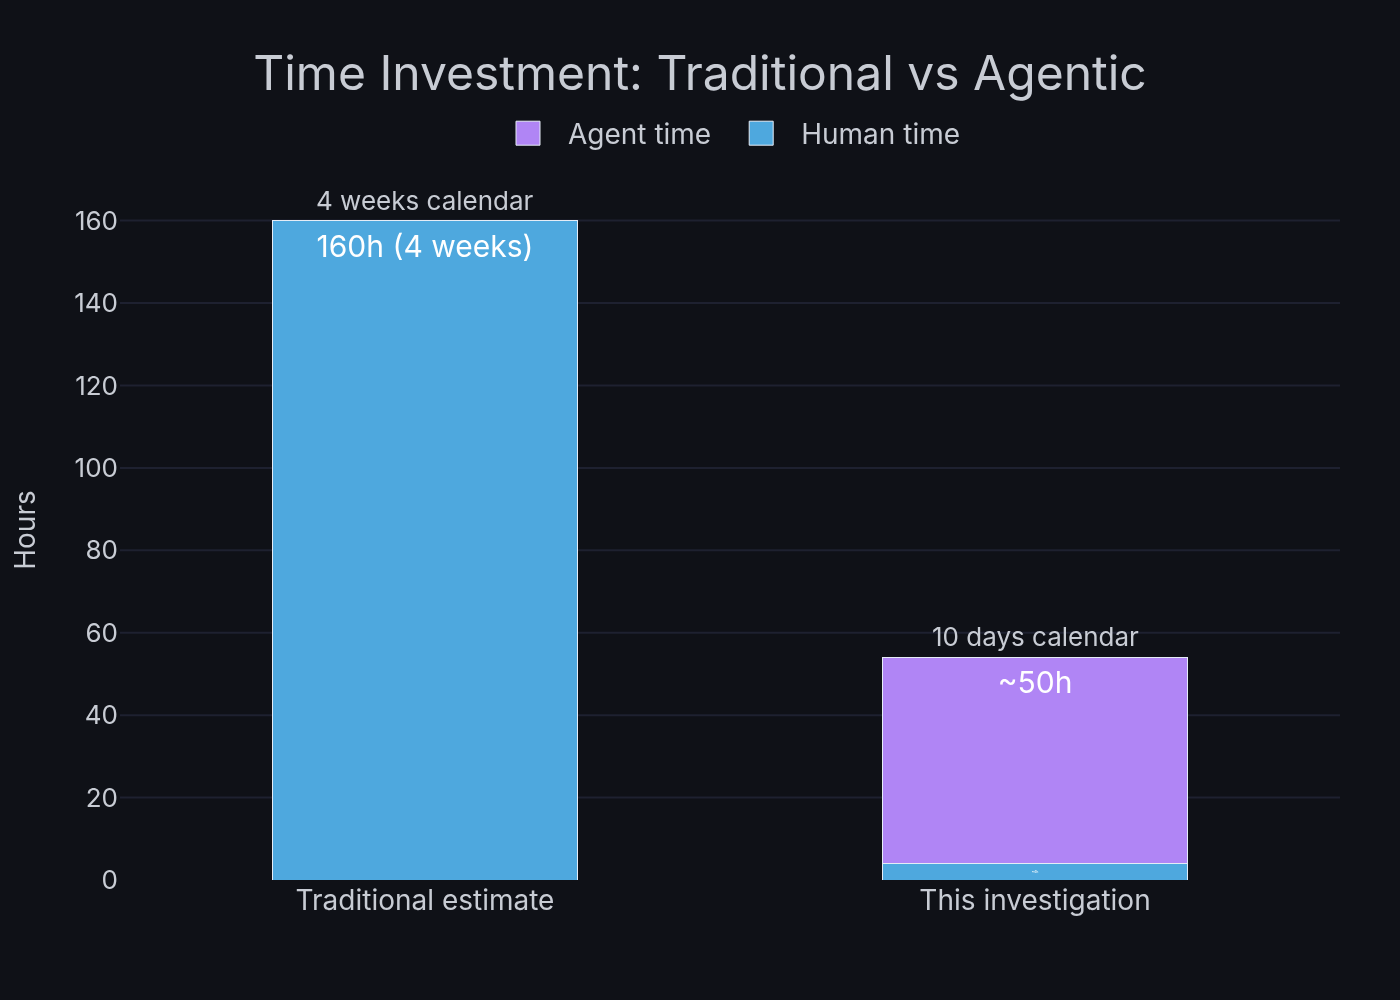
The conventional path, a senior embedded engineer spending weeks with a debugger and profiler methodically working through the rendering pipeline, would have taken 6-7 weeks of dedicated work (see appendix for itemised estimate). Worse, early results might have suggested the hardware wasn’t capable, triggering a redesign discussion that delays the project by months.
Instead I set up an agentic investigation and went back to my other work.
This is a case study in methodology, not magic. The approach is transferable to any performance investigation where you can define a measurable metric and iterate autonomously.
The Methodology
The approach that emerged rests on three principles I think are broadly applicable to any autonomous AI debugging workflow.
1. Define an Autonomous Eval
Before touching any code, I needed a metric that Claude Code agents could measure independently, without me watching. The 20-key keyboard benchmark became this: select each of 20 buttons in sequence, measure lv.timer_handler() execution time for each via time.ticks_us(), report average/min/max.
Same principle behind evals in ML. If you can’t measure it automatically, you can’t iterate on it autonomously. The benchmark script runs on the device via mpremote, takes ~5 seconds, and produces a single number (average ms per frame). An agent can build firmware, flash it, run the benchmark, and report whether a change helped, all without human intervention.
2. Keep a Persistent Investigation Log
Claude Code sessions have context limits. Long sessions get compacted. Sub-agents can’t see the main session’s history. The investigation log (INVESTIGATION_LOG.md) is the shared memory that survives all of this, a chronological record of what was tested, what was measured, and what was concluded.
Every agent writes its findings to this log. When a new session starts (or context compresses), the log provides continuity. This turned out to be pretty critical: the investigation spanned 21+ sessions across 10 days. Without the log, each session would have started from scratch.
3. Delegate to Preserve Context
Every sub-task that involves deep code reading, building, or testing goes to a sub-agent. The main session stays lean, making decisions, steering direction, recording results. This isn’t just about parallelism (though that helps). It’s about keeping the orchestrator’s context window focused on investigation strategy rather than filled with build output and source code.
The Test Rig
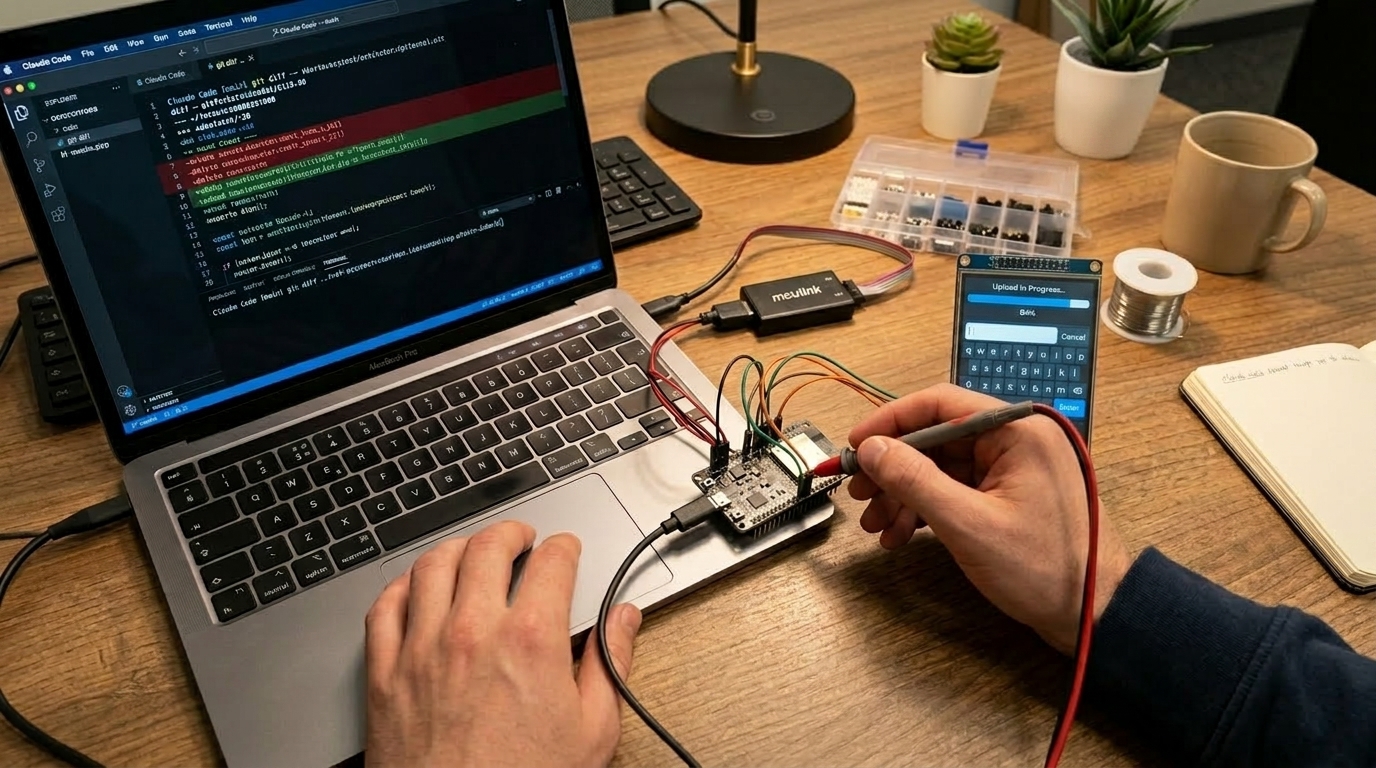
The hardware setup gave Claude two independent channels into the device: a USB serial REPL and an SWD debug probe (MCU-LINK and later J-Link). Both stayed connected in a tmux session on my laptop the entire time.
The REPL is a MicroPython thing, and it turned out to be pretty critical for this workflow. Because the application layer is Python, Claude could interact with the running system live via mpremote, inject test scripts, modify widget configurations at runtime, read back performance counters, even trigger garbage collection and measure how long it took, all without rebuilding firmware. The turnaround for testing a hypothesis at the application level was seconds, not the minutes-per-cycle you’d get with a compiled-only stack.
When the investigation needed to go deeper, the SWD probe gave access to CPU registers, memory contents, and on-chip debug peripherals like the DWT cycle counters. Claude used this to add C-level instrumentation inside LVGL’s render loop, measuring exactly how many cycles each phase consumed. The probe also handled flashing new firmware builds autonomously.
Between the two channels, an agent could: build firmware with a C-level change, flash it via SWD, boot into MicroPython, run a Python benchmark script over the REPL, and report results, all in one automated sequence. That closed loop is what made overnight autonomous operation possible.
The Brainstorm
I described the problem to Claude Code and launched a team brainstorm: four parallel agents (hardware-focused, software-focused, a critic, and a side investigation into GPIO interrupt support) collaborating through a shared channel. The inputs were pretty simple: the hardware platform, the symptom (keyboard rendering at 183ms/frame, ~5 FPS), and one observation that garbage collection (MicroPython’s automatic memory cleanup, which pauses everything while it runs) seemed to have a surprisingly large effect on performance.
Within an hour, with zero further input from me, they produced 23 hypotheses across hardware and software domains, ranked them by information value per unit of effort, and organised them into a four-phase test plan. The hypotheses ranged from cache pollution and SDRAM bus contention through to LVGL draw task allocation patterns, font rendering costs, and garbage collection pressure from the widget tree. The hardware and software agents cross-pollinated findings between their perspectives, which was exactly what the team structure was designed for.
Their top-ranked hypothesis (software rotation causing cache eviction causing slow garbage collection) turned out to be wrong. Later testing showed rotation was less than 1% of frame time. But that’s the point of a brainstorm followed by measurement, you generate hypotheses quickly and refute them quickly. The test plan itself was the real deliverable, a structured sequence of experiments that drove the rest of the investigation and led to the actual root causes.
I reviewed the test plan in about 10 minutes and approved.
The Overnight Shift
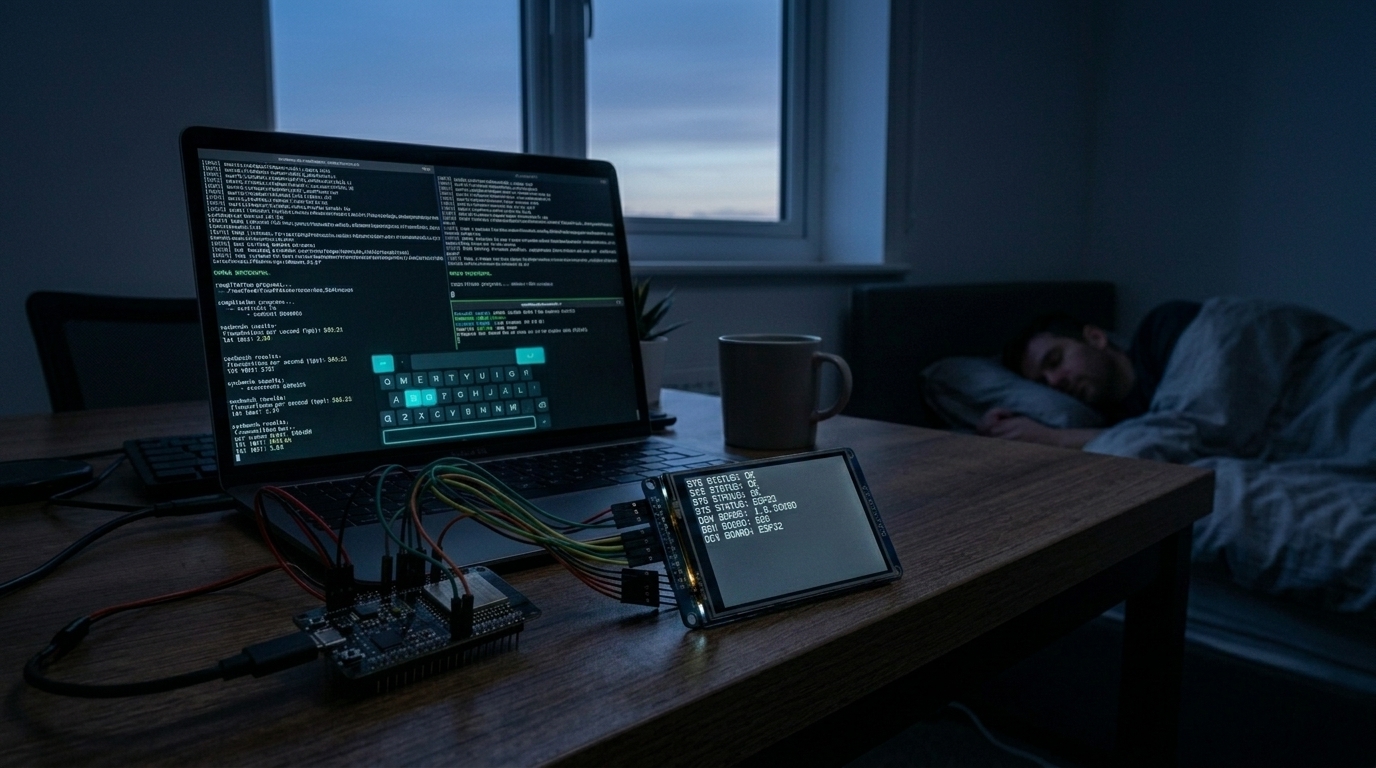
With the test plan approved, I left Claude running in a tmux session with the hardware connected and went to work on other projects. Seven agents ran in parallel for 21+ hours, each taking a different thread from the plan: building firmware, flashing, running benchmarks on the actual device, and writing results back to the investigation log.
The biggest finding came from a linker planning agent. It identified that the 64MB garbage collection heap included the display framebuffers, meaning every collection cycle was scanning 5MB of pixel data it would never free. Each collection blocked the system for 107ms. The fix: move framebuffers into dedicated linker sections outside the managed heap, and cap the heap at 16MB.
Other agents worked in parallel:
- A styling agent measured per-button border rendering cost (10ms overhead across 40 buttons) and tested flat-fill alternatives
- An SWO trace agent spent 4+ hours setting up on-chip debug trace, ultimately confirming that DWT PC sampling doesn’t work on this silicon revision. A dead end, but a valid experimental result that produced a working ITM printf path used later
- A touch driver agent implemented interrupt-driven input to replace polling
When I checked in the next morning, a build-flash-test agent had already compiled firmware with the accumulated fixes and benchmarked it: 57ms average (18 FPS), down from 183ms (5 FPS). Garbage collection alone dropped from 107ms to 61 microseconds, a 1,750x improvement. The brainstorm’s rotation hypothesis was wrong, but the investigation plan it generated led directly to finding the real issue: the heap was just too big.
I didn’t write any of that code. I didn’t run any of those tests.
Hitting a Plateau
The autonomous work brought us from 183ms to about 32ms (31 FPS) over the next couple of days. Good progress, just crossing the responsive threshold, but typing still felt sluggish. I was doing a couple of things at this point.
First, I prompted a separate agent to compare our hardware configuration against the Phytec-provided Zephyr profile for the same system-on-module, looking for differences in clock speeds, bus timing, SDRAM configuration, MIPI settings. It came back pretty clean, the configs were broadly similar. No smoking gun there, but it ruled out a whole class of potential issues.
Second, I called out that the trial-and-error styling approach wasn’t productive: “this trial and error approach isn’t working, need a real benchmark up and down the stack.” This forced the shift to systematic instrumentation. Claude added DWT cycle counter profiling inside LVGL’s render loop, and the results were clear: style resolution (LVGL walking the widget property tree to resolve colours, borders, fonts for each button) consumed 95-97% of render time.
The Clip Area Fix
This led directly to a fix in LVGL’s buttonmatrix widget. The draw_main() function was iterating all 40 buttons on every frame, doing full style resolution on each one, regardless of which part of the screen was actually dirty. Adding a clip area check to skip off-screen buttons before the expensive style resolution loop was a four-line change. 4x improvement. Submitted upstream as lvgl/lvgl#9946.
That brought us to about 25ms (40 FPS). Better, but still not where it should be.
The Key Engineer Insight
The profiling showed that style resolution was the bottleneck, but the agents had been focused on reducing the amount of work (skip off-screen buttons, simplify styles). The question I kept coming back to was: why is this slow at all? LVGL keyboards work fine on much slower MCUs.
The difference is memory. Those slower MCUs all use on-chip SRAM for everything. Our RT1176 has 64MB of external SDRAM, and that’s where the MicroPython GC heap lived, which is where LVGL allocates all its widget objects and style data. The scattered read pattern of LVGL’s style property walks was hitting SDRAM cache miss latency on every access, probably around 40 cycles per miss compared to single-cycle access for on-chip memory.
I asked Claude to test moving the GC heap from SDRAM to the chip’s on-chip OCRAM (1.25MB, much smaller but much faster). Frame time dropped from 25.7ms to 9.3ms (107 FPS). A 3x speedup from changing two lines in the linker script.
The agents had spent hours profiling the render pipeline. The fix was a memory placement decision that came from embedded systems intuition about cache behaviour. This is the collaboration model: AI is thorough and tireless at instrumentation and measurement; the human provides the architectural intuition that reframes the problem.
Colleague Replication
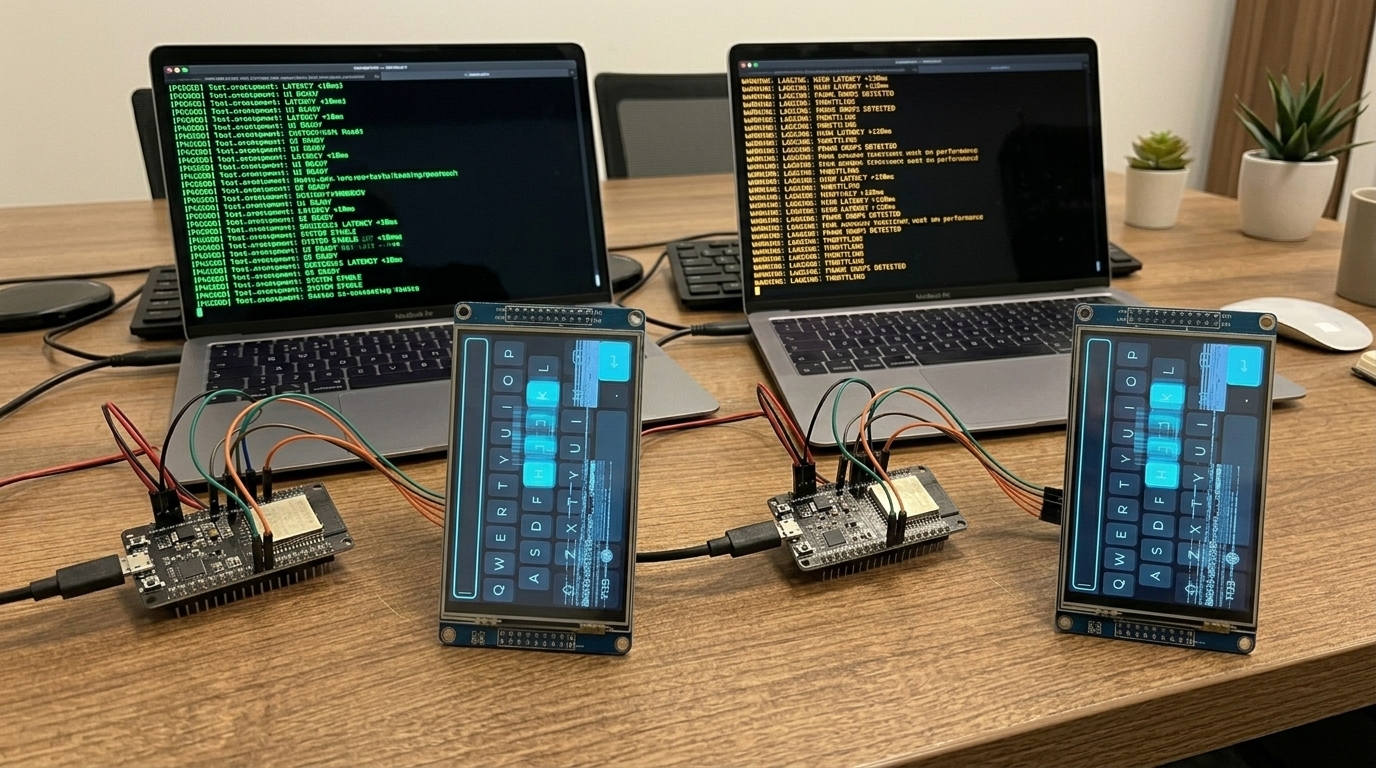
Once the initial results looked good, a colleague tried to replicate the build on their hardware. This is a step I’d recommend for any investigation, it catches assumptions you’ve baked in without realising.
They hit two issues. First, LV_DRAW_BUF_ALIGN was set to 4 in the committed config but I’d been building with 32 locally (needed for PXP and cache line alignment). The build failed for them. Second, even after fixing that, they measured 174ms (6 FPS), basically back to square one.
This led to investigating what was different about their build. It turned out PXP (NXP’s Pixel Processing Pipeline) draw acceleration was completely disabled in our config, LV_USE_PXP=0. The earlier Zephyr comparison had noted PXP existed in the Zephyr config but at the time it wasn’t clear it mattered for draw operations (we’d been thinking of PXP mainly for rotation). Enabling it offloads rectangle fills and blits from CPU to hardware.
The Final Push
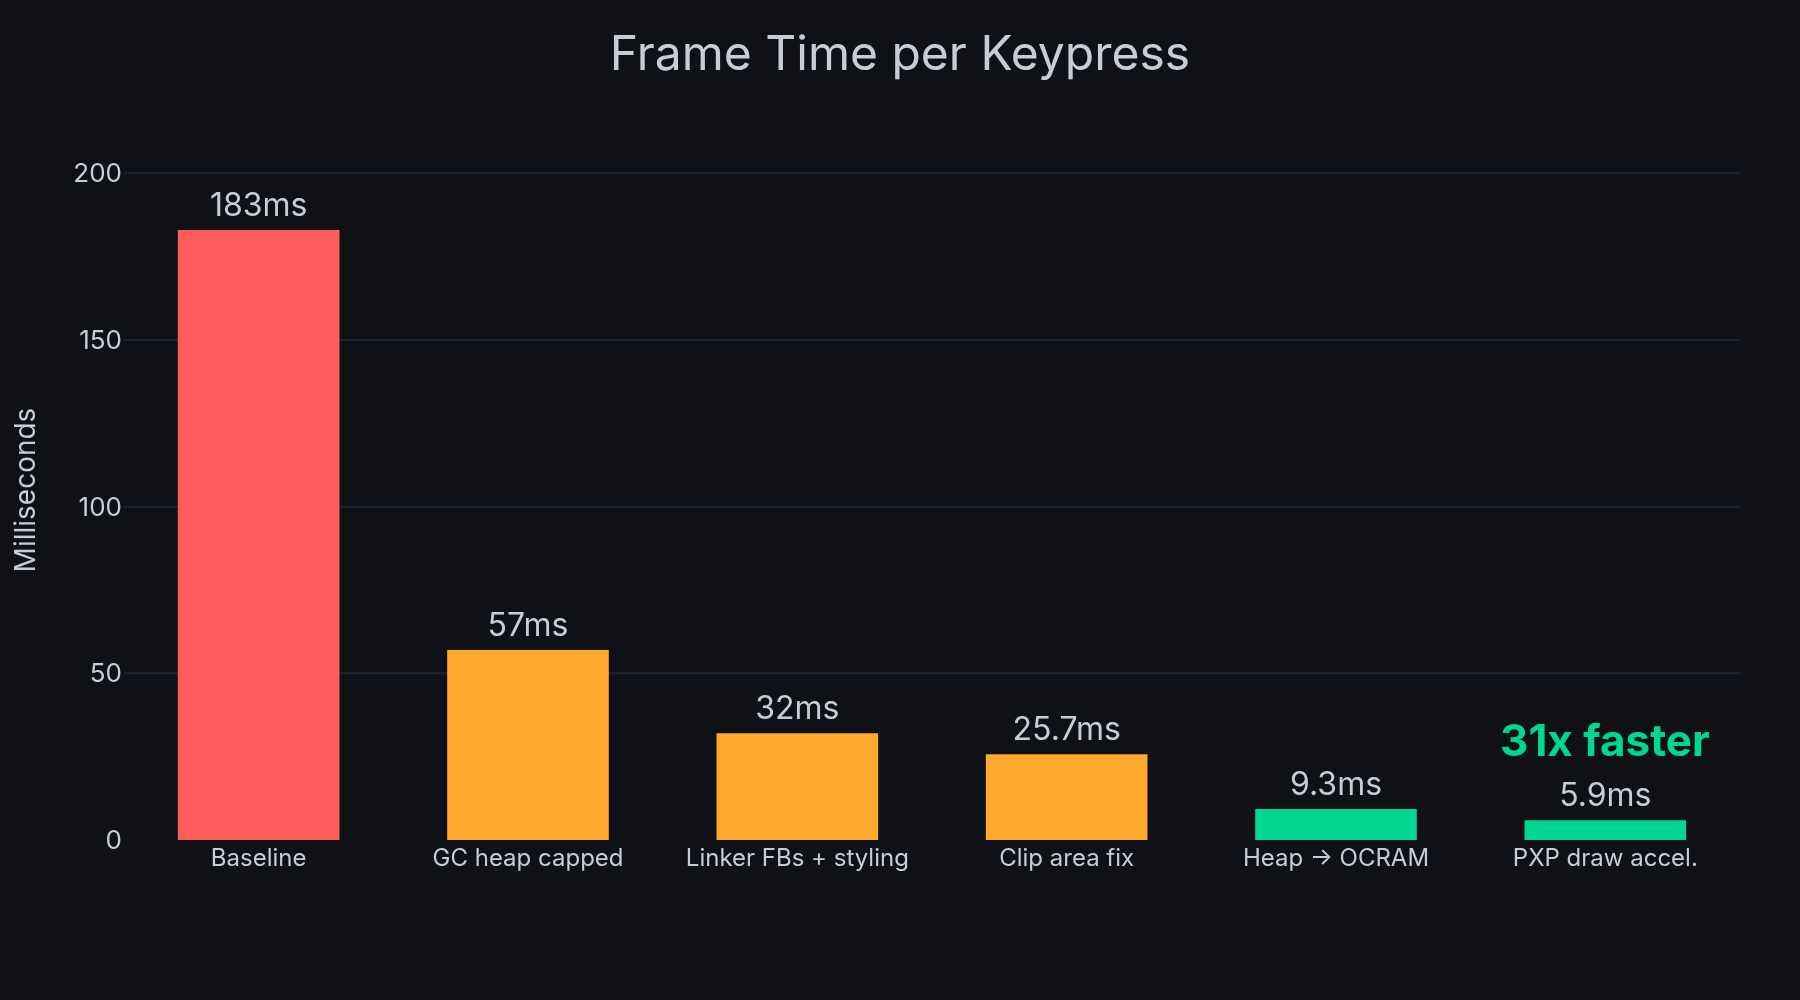
With PXP draw enabled: 5.9ms average. 169 FPS. 31x improvement from baseline.
Then we went further. Runtime display rotation from Python (so the application chooses portrait or landscape at init time, not a compile-time rebuild). Centralised build configuration across the display driver, LVGL binding, and board config (3-phase spec/plan/execute cycle with independent review agents at each step). Widget demos in both orientations. The upstream LVGL PR with AI-assisted code review. The autonomous execution pipeline handled the implementation while I provided direction.
The Numbers
| Metric | Value |
|---|---|
| Starting performance | 183ms / 1-2 FPS |
| Final performance | 5.9ms / 169 FPS |
| Improvement | 31x |
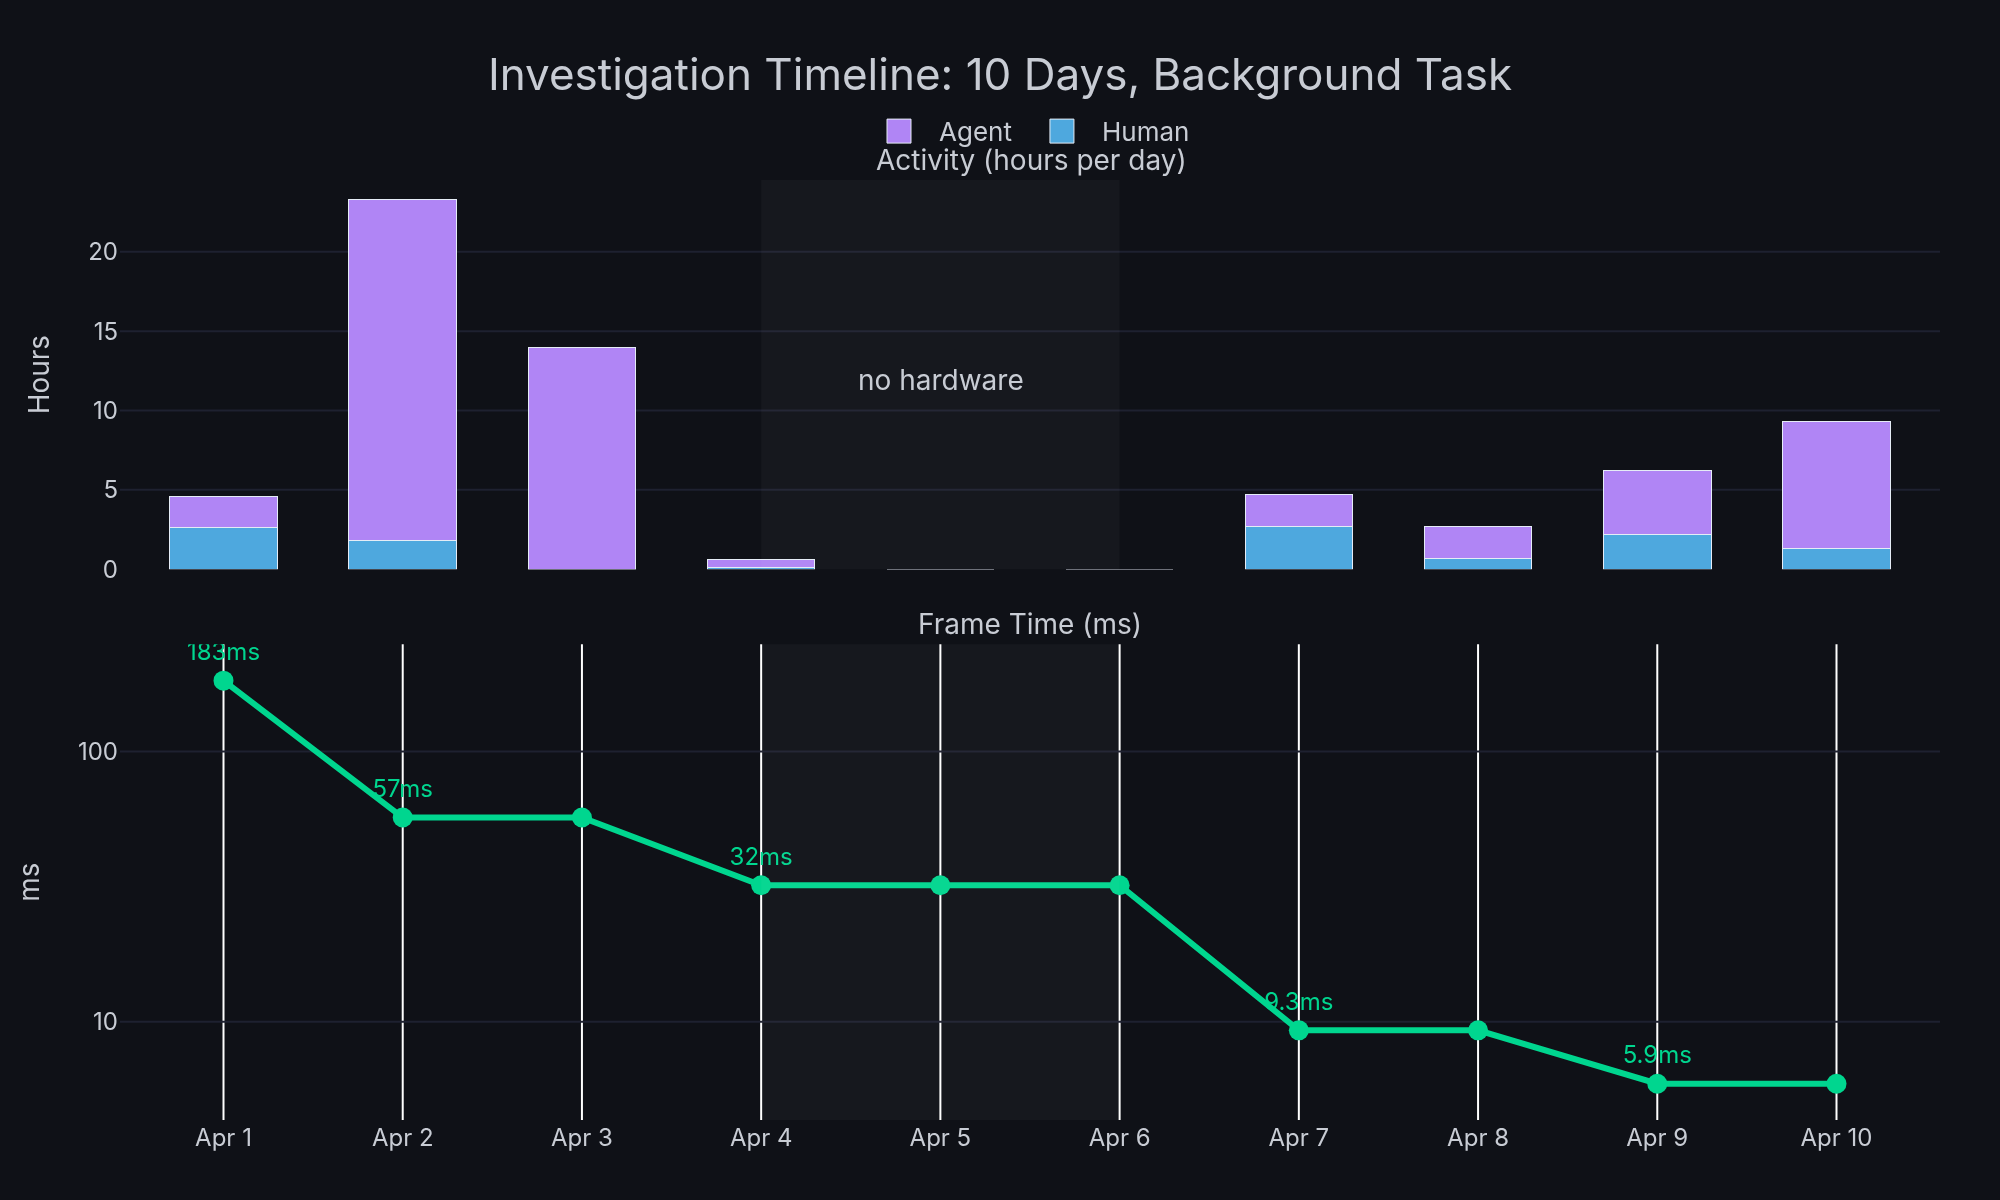
| Calendar time | 10 days |
| My active attention | ~5 hours total (see appendix) |
| Autonomous agent work | ~50 hours |
| Root causes found | 5 |
| Upstream contributions | 1 LVGL PR |
| Commits | 29 across 4 repositories |
During this investigation I was actively working on 4-5 other projects. The performance work was a background task, periodic check-ins to review autonomous results, provide hardware access, and make directional decisions. Claude’s session limits got hit a few times and we had to restart with fresh context, but the investigation log kept continuity.
Five Root Causes
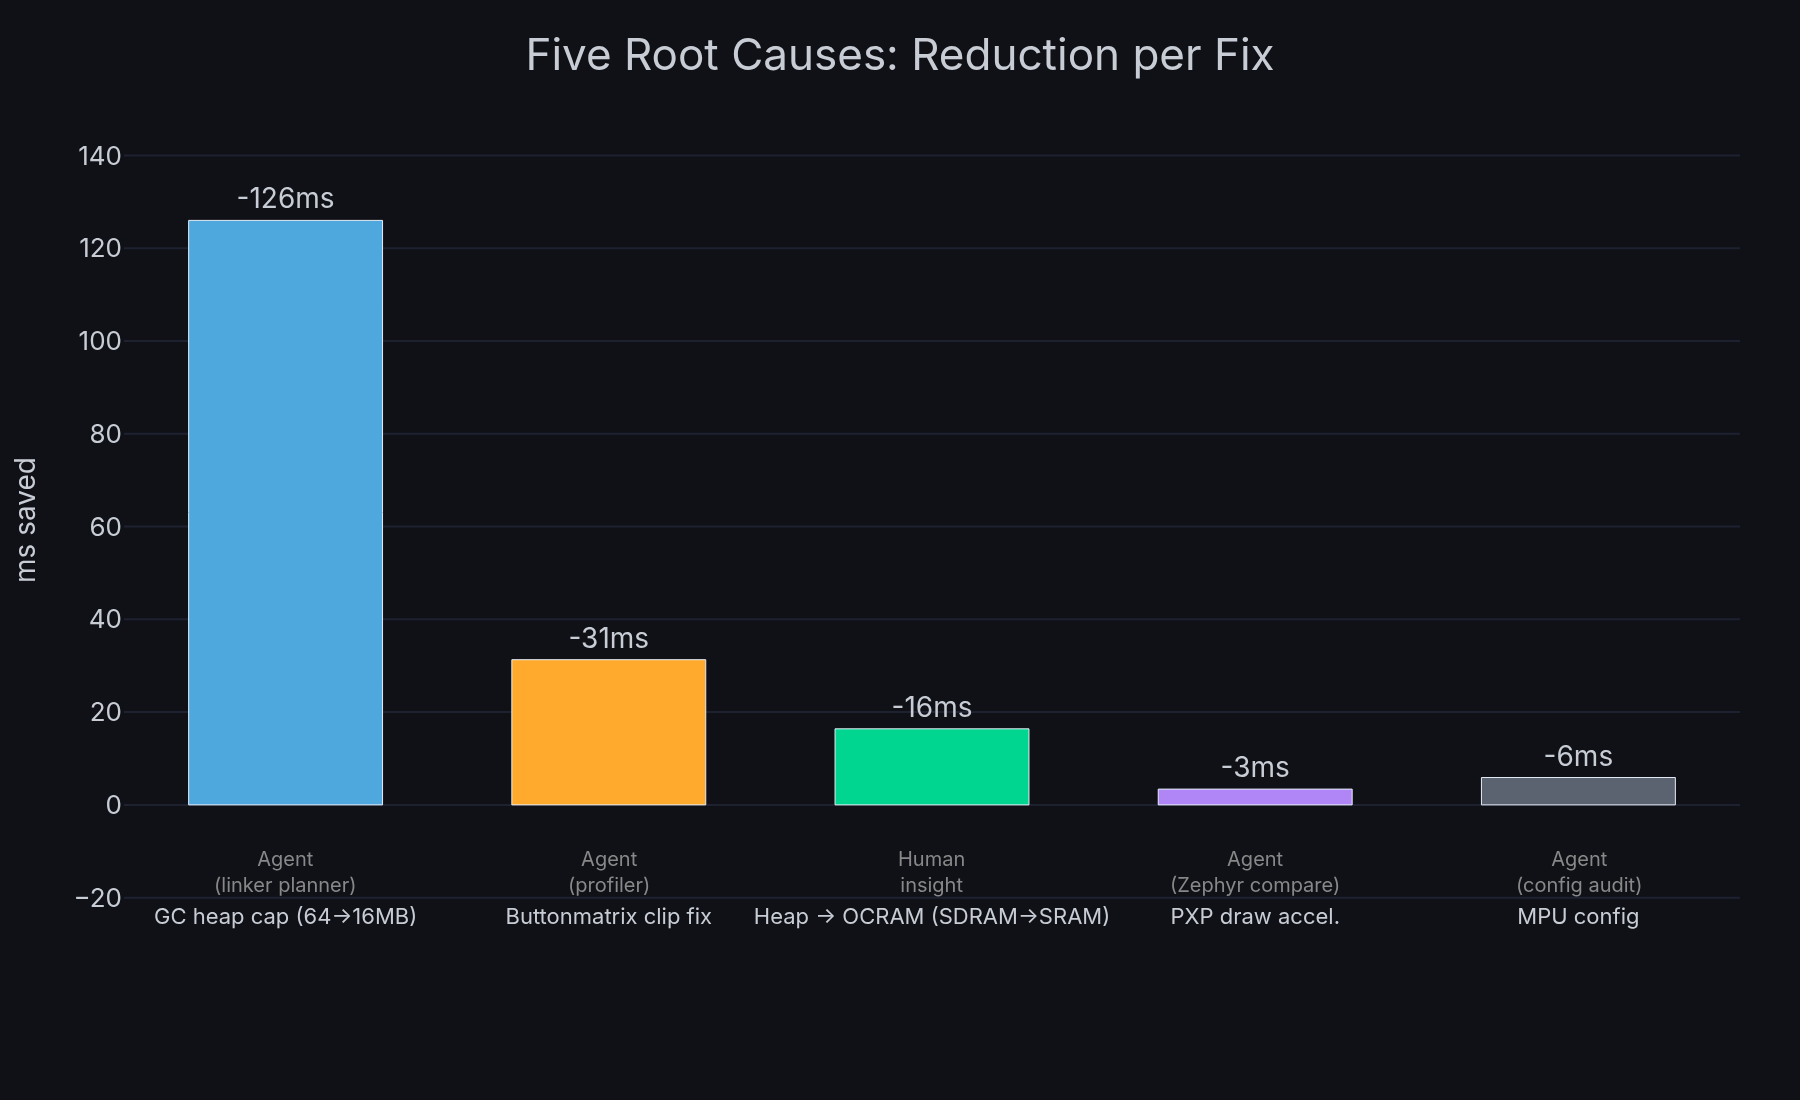
No single fix solved the problem. Each was necessary, and the investigation uncovered them roughly in this order:
- Garbage collection heap scanning 64MB of SDRAM including framebuffers, capping to 16MB and moving framebuffers to linker sections dropped collection time from 107ms to 61us (183ms/5 FPS to 57ms/18 FPS)
- MPU not configured for cacheable SDRAM access, 31% improvement on memory operations
- LVGL buttonmatrix rendering all 40 buttons every frame regardless of which area was dirty, clip area check gives 4x
- Heap in SDRAM (external memory with cache miss latency), moving to on-chip OCRAM gives 3x on the style resolution hot path (25.7ms/39 FPS to 9.3ms/107 FPS)
- PXP draw acceleration disabled, enabling hardware rectangle fills gives 1.6x (9.3ms/107 FPS to 5.9ms/169 FPS)
What Didn’t Work
Honest accounting matters for methodology.
SWO DWT PC sampling consumed ~6 hours of agent time across two days. The conclusion: it doesn’t work on this silicon revision. Valid result, but checking the errata sheet first would have saved the time. The investigation did produce a working ITM printf path that was used for later C-level profiling though.
Trial-and-error styling changes. I explicitly called this out as unproductive early on: “this trial and error approach isn’t working, need a real benchmark up and down the stack.” This forced the shift to systematic DWT instrumentation, which is what actually identified style resolution as the bottleneck.
SNVS register access for battery-backed storage caused hard faults. We didn’t have the access control sequence right. Deferred, and the failed attempt led to identifying an upstream MicroPython feature request that would solve it properly.
Transferable Methodology
Strip away the embedded specifics and the approach is:
Start with a brainstorm, not code. Launch parallel agents with different perspectives on the problem. The brainstorm’s main hypothesis in this investigation turned out to be wrong, but the structured test plan it produced drove the entire investigation forward. Hypotheses that get tested and refuted quickly are still progress.
Define your eval before optimising. A metric that agents can measure autonomously is the foundation. Without it every change requires a human to evaluate, and you’ve lost the ability to iterate in the background.
Log everything persistently. The investigation log is the shared memory across sessions, agents, and context window resets. It’s cheap to maintain and pretty much invaluable for continuity.
Delegate execution, keep strategy. Sub-agents do the building, testing, code reading, and profiling. The main session stays focused on “what should we try next” rather than “how do we implement it.”
Let agents run overnight. 21+ hours of parallel investigation happened while I was working on other things. The ROI of this approach compounds when you treat AI agents as a team that works while you sleep.
Engineer intuition still matters. The biggest single improvement (3x from OCRAM) came from an engineer’s observation about slower MCUs. The agents measured everything precisely but didn’t make the lateral connection. This is the collaboration, AI thoroughness multiplied by human intuition.
Have someone else replicate your results. The colleague’s failed build exposed a config assumption I’d missed, and the investigation into their poor performance led directly to the final PXP unlock.
Contribute upstream. The LVGL clip area fix benefits everyone using LVGL buttonmatrix widgets. Agentic investigation can produce upstream-quality contributions, not just local patches.
The investigation used Claude Code (Anthropic’s CLI) with Opus for orchestration and sub-agents. The target was an NXP i.MX RT1170 running MicroPython with LVGL v9 on a 720x1280 MIPI DSI display. All code changes, benchmarks, and the upstream LVGL PR are real and in production.
Appendix: How “Five Hours” Was Estimated
Claiming a specific time investment in an AI-assisted workflow is tricky. Traditional time tracking doesn’t apply when the work happens across 21+ sessions over 10 days, interleaved with 4-5 other active projects. Here’s how we arrived at the number.
Step 1: Extract raw data. Claude Code logs every message as JSONL with timestamps and a userType field that distinguishes genuine human input from agent-to-agent messages. We extracted all userType=external messages from the skydeck project sessions, deduplicated across session branches (the same message appears in multiple JSONL files when sessions fork or continue), and filtered out system notifications, command invocations, and pasted context blocks.
Result: 250 genuine typed messages across 8 active days.
Step 2: Measure typing volume. Messages over 150 words were classified as pasted content (context summaries, skill invocations, quoted logs) rather than typed input. The remaining 250 messages averaged 23 words each, totalling 5,859 words of actual typing.
At a typing speed of 60 WPM, that’s 98 minutes of pure typing time.
Step 3: Apply a multiplier. Typing is only part of interaction time. You also read Claude’s responses, think about what to ask next, glance at hardware, and skim benchmark results. For short directive messages (most of mine averaged 23 words), the read-think-type cycle is maybe 3x the typing duration. Longer responses take more reading time, but I was skimming not reading line-by-line.
At 3x: 98 min x 3 = ~295 min (~5h).
Cross-validation. We also extracted human messages from all Claude projects active during the same period (11 projects total) to understand how my time was distributed. On the heaviest skydeck days, it accounted for 20-30% of my Claude interaction. On light days, under 10%. This is consistent with skydeck being a background task that I checked in on periodically between primary work on other projects.
What the number doesn’t include. The five hours covers direct interaction with Claude, reading its output and typing responses. It doesn’t include time thinking about the problem away from the keyboard, or the few minutes spent physically connecting/disconnecting hardware. It also doesn’t include the time spent writing this article.
| Method | Estimate |
|---|---|
| Pure typing at 60 WPM | 98 min (1.6h) |
| 3x multiplier (read + think + type) | 295 min (~5h) |
| Gap-based session analysis | 684 min (11.4h) |
| Proportional cross-project allocation | 357 min (5.9h) |
The gap-based method overestimates because it treats idle time between messages as active attention, when in practice I was working on other projects during those gaps. The proportional method underestimates because it can only see time spent typing, not reading. The typing-with-multiplier approach sits in the middle and aligns with my subjective recollection of the effort involved.
Traditional effort equivalent. To put the five hours in context, I itemised every discrete work thread in the investigation (71 threads total) and estimated each in story points as if performed by a senior embedded engineer working without AI assistance, accounting for cumulative context (later tasks build on earlier learnings). Using a scale where 1 SP = 1 working day, the total came to 31.5 SP, roughly 6-7 weeks of dedicated specialist time. For the full itemised breakdown see the effort analysis report, which covers all four phases including dead ends and their value.